
Quick answers
What to know before the next decision
What is a normal percent free PSA?
There is no single normal value. In the largest U.S. trial, a cutoff of 25% detected 95% of cancers in men with total PSA 4 to 10 ng/mL. Laboratory tables place a result above 25% in the lowest-probability band and a result of 10% or less in the highest.
Does a low percent free PSA mean cancer?
No. In men aged 60 to 69 with a ratio of 10% or less, the probability table used by Mayo Clinic Laboratories gives a 58% chance of finding cancer on biopsy, which leaves 42% with no cancer found. A large benign gland and sample handling can also move the number.
How is percent free PSA calculated?
Free PSA divided by total PSA, multiplied by 100. A free PSA of 0.9 ng/mL with a total PSA of 6.0 ng/mL is 15%. Some reports print the same value as a ratio of 0.15.
Report decoder
The three lines on a free PSA report
Most confusion starts here: free PSA is printed in ng/mL, but every published cutoff and risk table is written as a percentage.
| Line on the report | What it is |
|---|---|
| Total PSA (ng/mL) | All the PSA the assay can measure: free PSA plus PSA bound to the protein alpha-1-antichymotrypsin. |
| Free PSA (ng/mL) | The unbound portion only. It is a concentration, so it cannot be compared with a 25% or 10% cutoff. |
| % free PSA | Free PSA ÷ total PSA × 100. This is the number studies, cutoffs, and probability tables use. |
| Free:total ratio (0.00 to 1.00) | The same value written as a decimal. A ratio of 0.18 is 18% free PSA. |
Use the chart carefully. Some laboratories print the percentage only when total PSA falls between 4.0 and 10.0 ng/mL, because that is the range the test was validated in. Outside that range the published probability tables do not apply.
Choose the moment you are in
Turn the number into one documented next step.
Causes, confirmation, and the usual sequence after a raised result.
Open guide The result has not been confirmedPlan a repeat PSAA newly elevated PSA is usually repeated before a second marker, imaging, or biopsy.
Open guide Prostate size is knownAdd PSA densityA large benign gland raises total PSA and tends to raise percent free PSA. Density accounts for volume directly.
Open guide Imaging is being discussedUnderstand prostate MRIWhat MRI adds to a blood-marker result before a biopsy decision.
Open guide Looking for a urologistFind prostate careWhere the care network stands today and the established routes to use now.
Open guideFree PSA and bound PSA are two forms of one protein
PSA is an enzyme made by prostate tissue. Once it reaches the bloodstream, most of it is captured by a blood protein called alpha-1-antichymotrypsin. That captured form is bound, or complexed, PSA. The remainder circulates on its own and is called free PSA. A standard PSA test reports the two together as total PSA.
In 1991, research groups in Finland and Sweden showed that bound PSA is the predominant form in blood, and that the bound share is higher in men with prostate cancer than in men with benign enlargement. The reverse reading is the one used in clinic: the smaller the free share, the more concern. Why cancer shifts the balance is not fully settled, and the test does not depend on the explanation. It depends on the pattern seen in biopsy studies.
How percent free PSA is calculated
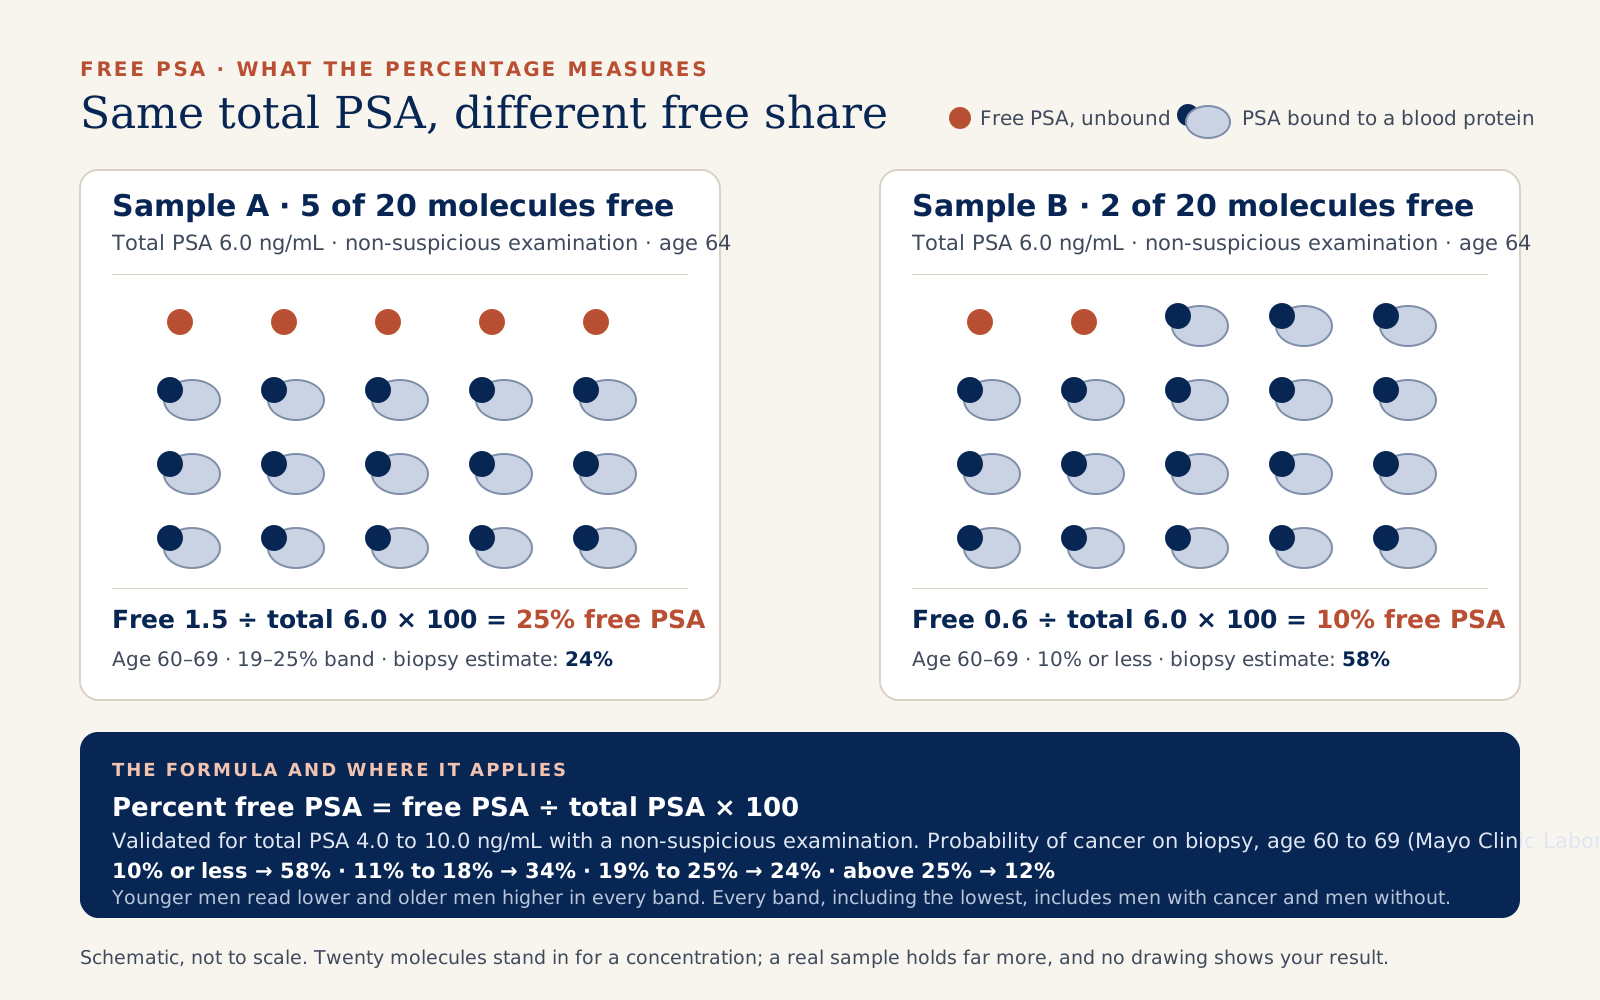
Divide the free PSA by the total PSA from the same blood draw and multiply by 100. A free PSA of 0.9 ng/mL with a total PSA of 6.0 ng/mL is 0.9 ÷ 6.0 = 0.15, or 15% free PSA. Both values must come from the same sample and the same laboratory method.
A free PSA concentration has no meaning alone. A free PSA of 1.2 ng/mL is 30% of a total PSA of 4.0 ng/mL and 12% of a total PSA of 10.0 ng/mL, and those two percentages fall in opposite risk bands. If the report lists free PSA without a percentage, the arithmetic can be done by hand, but the published tables apply only when total PSA is between 4.0 and 10.0 ng/mL.
When the test is meant to be used
Free PSA was validated for a narrow question: a man aged 50 or older, a total PSA between 4.0 and 10.0 ng/mL, and a rectal examination that does not feel suspicious. That range is sometimes called the diagnostic gray zone, because total PSA alone separates cancer from benign enlargement poorly there. The National Cancer Institute notes that only about 25% of men who have a biopsy because of an elevated PSA are found to have prostate cancer.
Outside that range the test adds less. Mayo Clinic Laboratories notes that below 2.0 ng/mL the probability of cancer in a man without symptoms is low and free PSA may add little, and that above 10.0 ng/mL the probability is high enough that the total PSA usually drives the decision.
The range from 2.6 to 4.0 ng/mL has been studied as well. In a screening study of men in that range with a benign examination, cancer was found in 22% of the 332 who had a biopsy, and a cutoff of 27% or less would have detected 90% of those cancers while avoiding 18% of benign biopsies. A later review of 66 studies found the ratio performs significantly worse in the 2 to 4 range than in the 4 to 10 range.
Percent free PSA by age: the probability table laboratories print
Many U.S. lab reports carry the table below. It gives the probability of finding prostate cancer on needle biopsy for men whose total PSA is between 4.0 and 10.0 ng/mL, grouped by free-to-total ratio and by age. These are the figures published in the Mayo Clinic Laboratories test catalog. Within every ratio band the probability rises with age, which is why age belongs in the reading.
The underlying evidence is the 1998 multicenter trial: 773 men aged 50 to 75 at seven university centers, all with total PSA 4.0 to 10.0 ng/mL and a palpably benign gland. Across that group, individual risk ran from 8% at the highest percent free PSA to 56% at the lowest.
Two limits apply. The studies were run in the 1990s, before prostate MRI was part of the pathway, and they counted any cancer found on biopsy rather than only higher-grade cancer. The table also describes groups of men. It cannot say which individual in a band has cancer.
| Free:total PSA ratio | Age 50 to 59 | Age 60 to 69 | Age 70 and older |
|---|---|---|---|
| 10% or less | 49% | 58% | 65% |
| 11% to 18% | 27% | 34% | 41% |
| 19% to 25% | 18% | 24% | 30% |
| More than 25% | 9% | 12% | 16% |
One total PSA, four different free PSA results
Take a 64-year-old with a confirmed total PSA of 6.0 ng/mL and a normal examination. The total PSA is the same in all four cases below. Only the free PSA changes, and the table reading moves from 58% to 12%.
The bands are wide and the edges are abrupt. A free PSA of 1.5 ng/mL sits at exactly 25%, and 1.6 ng/mL moves to the lowest band, a difference smaller than normal variation between two blood draws. That is the reason a percent free PSA near a cutoff is often repeated or read beside other information instead of being treated as a verdict.
| Free PSA | Calculation | Percent free PSA | Table reading, age 60 to 69 |
|---|---|---|---|
| 0.5 ng/mL | 0.5 ÷ 6.0 | 8% | 58% |
| 0.9 ng/mL | 0.9 ÷ 6.0 | 15% | 34% |
| 1.3 ng/mL | 1.3 ÷ 6.0 | 22% | 24% |
| 1.8 ng/mL | 1.8 ÷ 6.0 | 30% | 12% |
Explore a fictional lab report
Same total PSA, different picture
Change one number at a time to see how free PSA, total PSA and percent free PSA fit together. Free PSA divided by total PSA, multiplied by 100, gives the free share.
Educational examples only. The drawing and arithmetic do not diagnose cancer or choose a biopsy or treatment.
What the 25% and 10% cutoffs can and cannot do
In the 1998 trial, recommending biopsy at 25% free PSA or less detected 95% of cancers and avoided 20% of unnecessary biopsies. Read the other way, 5% of cancers sat above the cutoff. The authors reported that those cancers were more common in older men and were generally less threatening in grade and volume, but they were cancers.
The cost of keeping sensitivity that high is low specificity. Pooled across 66 studies, at 95% sensitivity the ratio correctly cleared 18% of men without cancer in the 4 to 10 ng/mL range, and 6% in the 2 to 4 range. Most men without cancer still fall below the cutoff.
The 10% line marks the highest-probability band in the table, not a diagnosis. At age 60 to 69 it corresponds to a 58% chance of cancer on biopsy. Mayo Clinic Laboratories states plainly that normal results do not eliminate the possibility of prostate cancer, and that up to 20% of men with a negative biopsy have later been found to have cancer.
What can shift a free PSA result besides cancer
Prostate size. Benign enlargement raises total PSA and tends to raise the free share with it. In a 1995 study of men with total PSA 4.1 to 10.0 ng/mL, median percent free PSA was 9.2% in men with cancer and a normal-sized gland, 15.9% in men with cancer and an enlarged gland, and 18.8% in men with benign enlargement alone. A large gland can mask a low ratio, which is one reason prostate volume and PSA density are read alongside it.
Sample handling. Free PSA is less stable in the tube than total PSA. Mayo Clinic Laboratories instructs that serum be separated within three hours of collection and accepts refrigerated samples for 72 hours. A 2024 laboratory study of serum from 45 men found total PSA stable in storage while free PSA declined, with the ratio holding for 72 hours before it fell. A delayed sample biases the percentage downward, toward a more worrying reading.
Laboratory method. Results from different assay kits are not interchangeable. Free and total PSA should be run on the same platform, and a change of laboratory between tests can move the percentage without any change in the prostate. Recent prostate biopsy or transurethral surgery can also raise PSA results, so blood is drawn before those procedures.
Finasteride and dutasteride. These medicines lower total PSA by about half. In a randomized trial, mean total PSA fell from 3.0 to 1.5 ng/mL after six months of finasteride while percent free PSA did not change significantly, and a second study found free and total PSA fell about equally. The practical points: tell the clinician about the medicine, because the total PSA needs adjustment, and know that the 4 to 10 ng/mL condition attached to the probability table refers to the measured total PSA.
Where free PSA sits beside PSA density, PHI, 4Kscore, and MRI
Free PSA was the first widely used second-line blood marker, and it is built into two newer ones. The Prostate Health Index combines total PSA, free PSA, and a free PSA subform called [-2]proPSA; it was evaluated in 892 men with total PSA 2 to 10 ng/mL and a normal examination. The 4Kscore combines four related blood markers, free PSA among them, with clinical information; it was evaluated in 1,012 men at 26 U.S. centers. Both were designed to estimate the chance of higher-grade cancer, which the original free PSA studies did not isolate.
The AUA/SUO early-detection guideline does not name one marker as the required next step. Its statement is that clinicians may use adjunctive urine or serum markers when further risk stratification would influence the decision whether to proceed with biopsy, graded as a conditional recommendation on Grade C evidence. The 2026 amendment updates the discussion of available biomarkers. The guideline also recommends confirming a newly elevated PSA before moving to any second-line test.
In practice the choice depends on what is already known. If prostate volume has been measured, PSA density uses it directly. If MRI is planned or done, its findings carry their own weight in the biopsy decision. Free PSA remains widely available and inexpensive, and it can be run on the same sample as the repeat PSA. Which combination fits is a question for the clinician who knows the examination, the history, and the prior values.
Turning the number into a plan
A percent free PSA result is one input to a biopsy decision. It is weighed with age, the total PSA and its trend, prostate size, the examination, family and inherited risk, medicines, prior biopsies, MRI findings when available, and overall health. A low percentage in a man with a small gland and a rising total PSA reads differently from the same percentage on a sample that waited a day before processing.
Whatever the number, the useful outcome of the visit is a written next step with a date: repeat the test under good conditions, add volume or imaging, proceed to biopsy, or monitor on a defined schedule with a trigger for earlier review. Fever with urinary symptoms, inability to urinate, or severe pain needs prompt medical attention regardless of any PSA value.
Frequently asked questions
Free PSA questions, answered carefully
Which matters more, total PSA or free PSA?
They answer different questions. Total PSA decides whether further evaluation is considered at all, and free PSA has no validated reading without it. Percent free PSA then refines the estimate inside the 4 to 10 ng/mL range. Neither replaces the other.
Is a low free PSA always cancer?
No. Even in the highest-probability band, 10% or less, between 35% and 51% of men in the laboratory table had no cancer found on biopsy, depending on age. A sample that was processed late can also lower the percentage.
Is percent free PSA above 25% an all-clear?
No. In men with total PSA 4 to 10 ng/mL, the table still shows a 9% to 16% probability of cancer above 25%, and the 1998 trial found 5% of cancers above that cutoff. It lowers the estimate; follow-up still needs an owner and a date.
Can I raise my free PSA?
Percent free PSA is a readout of what the prostate is releasing, not a level to be improved. No diet, supplement, or habit has been shown to raise it in a way that lowers cancer risk, and trying to move the number would only make it harder to interpret.
Does finasteride or dutasteride change percent free PSA?
These medicines cut total PSA by about half, but in two studies percent free PSA did not change significantly because free and total PSA fell together. The clinician still needs to know about the medicine to interpret the total PSA.
Why did my lab report free PSA without a percentage?
Some laboratories calculate the ratio only when total PSA is between 4.0 and 10.0 ng/mL, the range the test was validated in. Outside it, very low or very high total PSA is informative by itself and the probability tables do not apply.
Is free PSA used after prostate cancer treatment?
No. Free PSA is an early-detection tool for men who have not been diagnosed. After surgery, radiation, or other treatment, follow-up relies on total PSA read against a treatment-specific plan.
Bring these questions
Make the next appointment concrete.
- Was this total PSA confirmed with a repeat test before the free PSA was read?
- What is my percent free PSA, and which age band of the probability table applies to me?
- Were free and total PSA measured on the same sample, in the same laboratory, and processed promptly?
- Has my prostate volume been measured, and what is my PSA density?
- Do finasteride, dutasteride, a recent infection, or a recent procedure affect how this result is read?
- Would prostate MRI, PHI, 4Kscore, or another marker change the biopsy decision in my case?
- If we monitor, when is the next test and what result would trigger earlier review?
Sources and further reading
These primary references support the educational guide reviewed by Domenico Savatta, MD, FACS on September 20, 2026. They do not replace guidance from your own clinician.
- JAMA 1998: Use of the percentage of free PSA to enhance differentiation of prostate cancer from benign prostatic diseaseProspective blinded trial at seven U.S. university centers: 773 men aged 50 to 75 with total PSA 4.0 to 10.0 ng/mL and a palpably benign gland. A 25% free PSA cutoff detected 95% of cancers and avoided 20% of unnecessary biopsies; individual cancer risk ranged from 8% to 56%.
- Mayo Clinic Laboratories test catalog: PSA, Total and Free, Serum (PSAFT)Source of the probability-by-age table, the 4.0 to 10.0 ng/mL reporting rule for the ratio, the three-hour centrifuge instruction, 72-hour refrigerated stability, and the caution that results from different assay kits are not interchangeable. Retrieved September 19, 2026.
- JAMA 1995: Evaluation of percentage of free serum PSA to improve specificity of prostate cancer screening113 men with total PSA 4.1 to 10.0 ng/mL. Median percent free PSA was 9.2% with cancer and a normal-sized gland, 15.9% with cancer and an enlarged gland, and 18.8% with benign prostatic hyperplasia.
- JAMA 1997: Prostate cancer detection in men with serum PSA 2.6 to 4.0 ng/mL and benign prostate examinationCancer was found in 22% (73 of 332) of biopsied men. A percent free PSA cutoff of 27% or less would have detected 90% of cancers and avoided 18% of benign biopsies.
- European Urology 2005: Use of PSA isoforms for the detection of prostate cancer in men with a PSA level of 2 to 10 ng/mL, systematic review and meta-analysis66 studies. At 95% sensitivity, the specificity of the free-to-total ratio was 18% in the 4 to 10 ng/mL range and 6% in the 2 to 4 ng/mL range.
- Cancer Research 1991: A complex between PSA and alpha-1-antichymotrypsin is the major form of PSA in serum of patients with prostatic cancerFirst report that the bound proportion of PSA is higher in prostate cancer than in benign hyperplasia.
- Clinical Chemistry 1991: PSA in serum occurs predominantly in complex with alpha-1-antichymotrypsinIdentified the 80 to 90 kDa PSA and alpha-1-antichymotrypsin complex as the predominant form in blood, with free PSA as the minor fraction.
- Journal of Urology 1998: Influence of finasteride on free and total serum PSA levels in men with benign prostatic hyperplasiaRandomized, placebo-controlled trial in 40 men: mean total PSA fell from 3.0 to 1.5 ng/mL after six months of finasteride while percent free PSA did not change significantly.
- Urology 1997: Comparison of percent free PSA levels in men with BPH treated with finasteride, terazosin, or watchful waiting69 men: finasteride lowered total and free PSA about equally, so the median percent free PSA (23%) did not differ from terazosin (22%) or watchful waiting (25%).
- The Prostate 2024: Preanalytical stability of molecular forms of PSA in serum samples and their impact on the free-to-total ratio and PHISerum from 45 men: total PSA stayed stable in storage, free PSA declined over time, and the free-to-total ratio held for 72 hours before it fell. The authors recommend measuring promptly after collection.
- AUA/SUO Guideline 2023: Early Detection of Prostate Cancer, Part II, Considerations for a Prostate BiopsyStatement 17 (Conditional Recommendation; Evidence Level: Grade C): clinicians may use adjunctive urine or serum markers when further risk stratification would influence the decision whether to proceed with biopsy.
- AUA/SUO Guideline Amendment 2026: Early Detection of Prostate CancerCurrent amendment covering PSA screening, available biomarkers, MRI, initial and repeat biopsy, and biopsy technique.
- National Cancer Institute: Prostate-Specific Antigen (PSA) Test fact sheetUpdated January 31, 2025. States that only about 25% of men who have a biopsy because of an elevated PSA are found to have prostate cancer, and lists free PSA, the Prostate Health Index, IsoPSA, and the 4Kscore among follow-up blood tests.
- Journal of Urology 2011: Multicenter study of [-2]proPSA combined with PSA and free PSA for prostate cancer detection in the 2.0 to 10.0 ng/mL PSA range892 men with a normal rectal examination and total PSA 2 to 10 ng/mL. Defines the Prostate Health Index as [-2]proPSA divided by free PSA, multiplied by the square root of total PSA.
- European Urology 2015: A multi-institutional prospective trial in the USA confirms that the 4Kscore accurately identifies men with high-grade prostate cancer1,012 men at 26 U.S. centers. The 4Kscore combines four kallikrein blood markers, free PSA among them, with clinical information.